Building an Analytics Dashboard app using Laravel Filament

Full-Stack Developer

An analytics dashboard is a centralized location where you can view and analyze data from your website or app. This data can help you track your progress, identify areas for improvement, and make better decisions about your business.
There are many different ways to build an analytics dashboard. You can use a third-party tool, such as Google Analytics or Mixpanel, or you can build your own dashboard using a framework like Laravel Filament.
If you're building your own dashboard, there are a few things you'll need to consider:
- The data sources you'll need to connect to.
- The types of charts and graphs you want to use to visualize your data.
- The layout and design of your dashboard.
Once you've considered these factors, you can start building your dashboard. There are many different ways to do this, but the most important thing is to choose a framework that's easy to use and flexible enough to meet your needs.
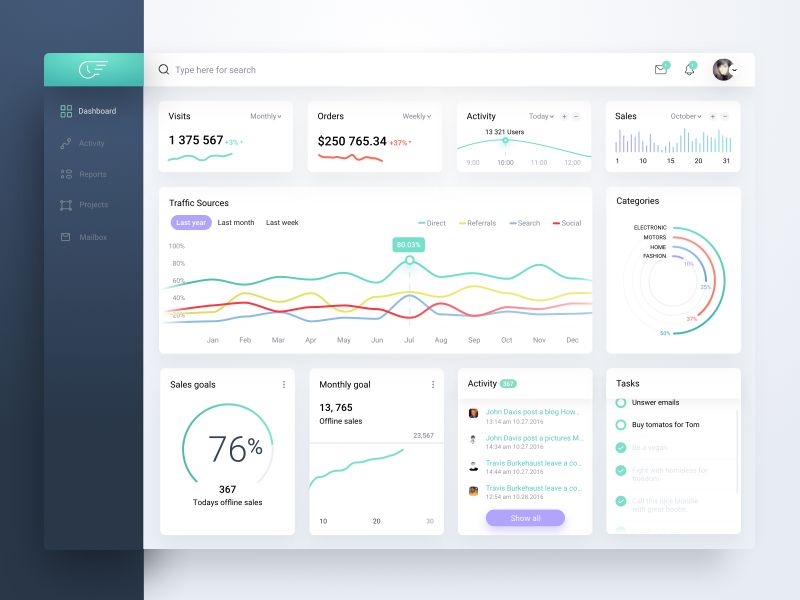
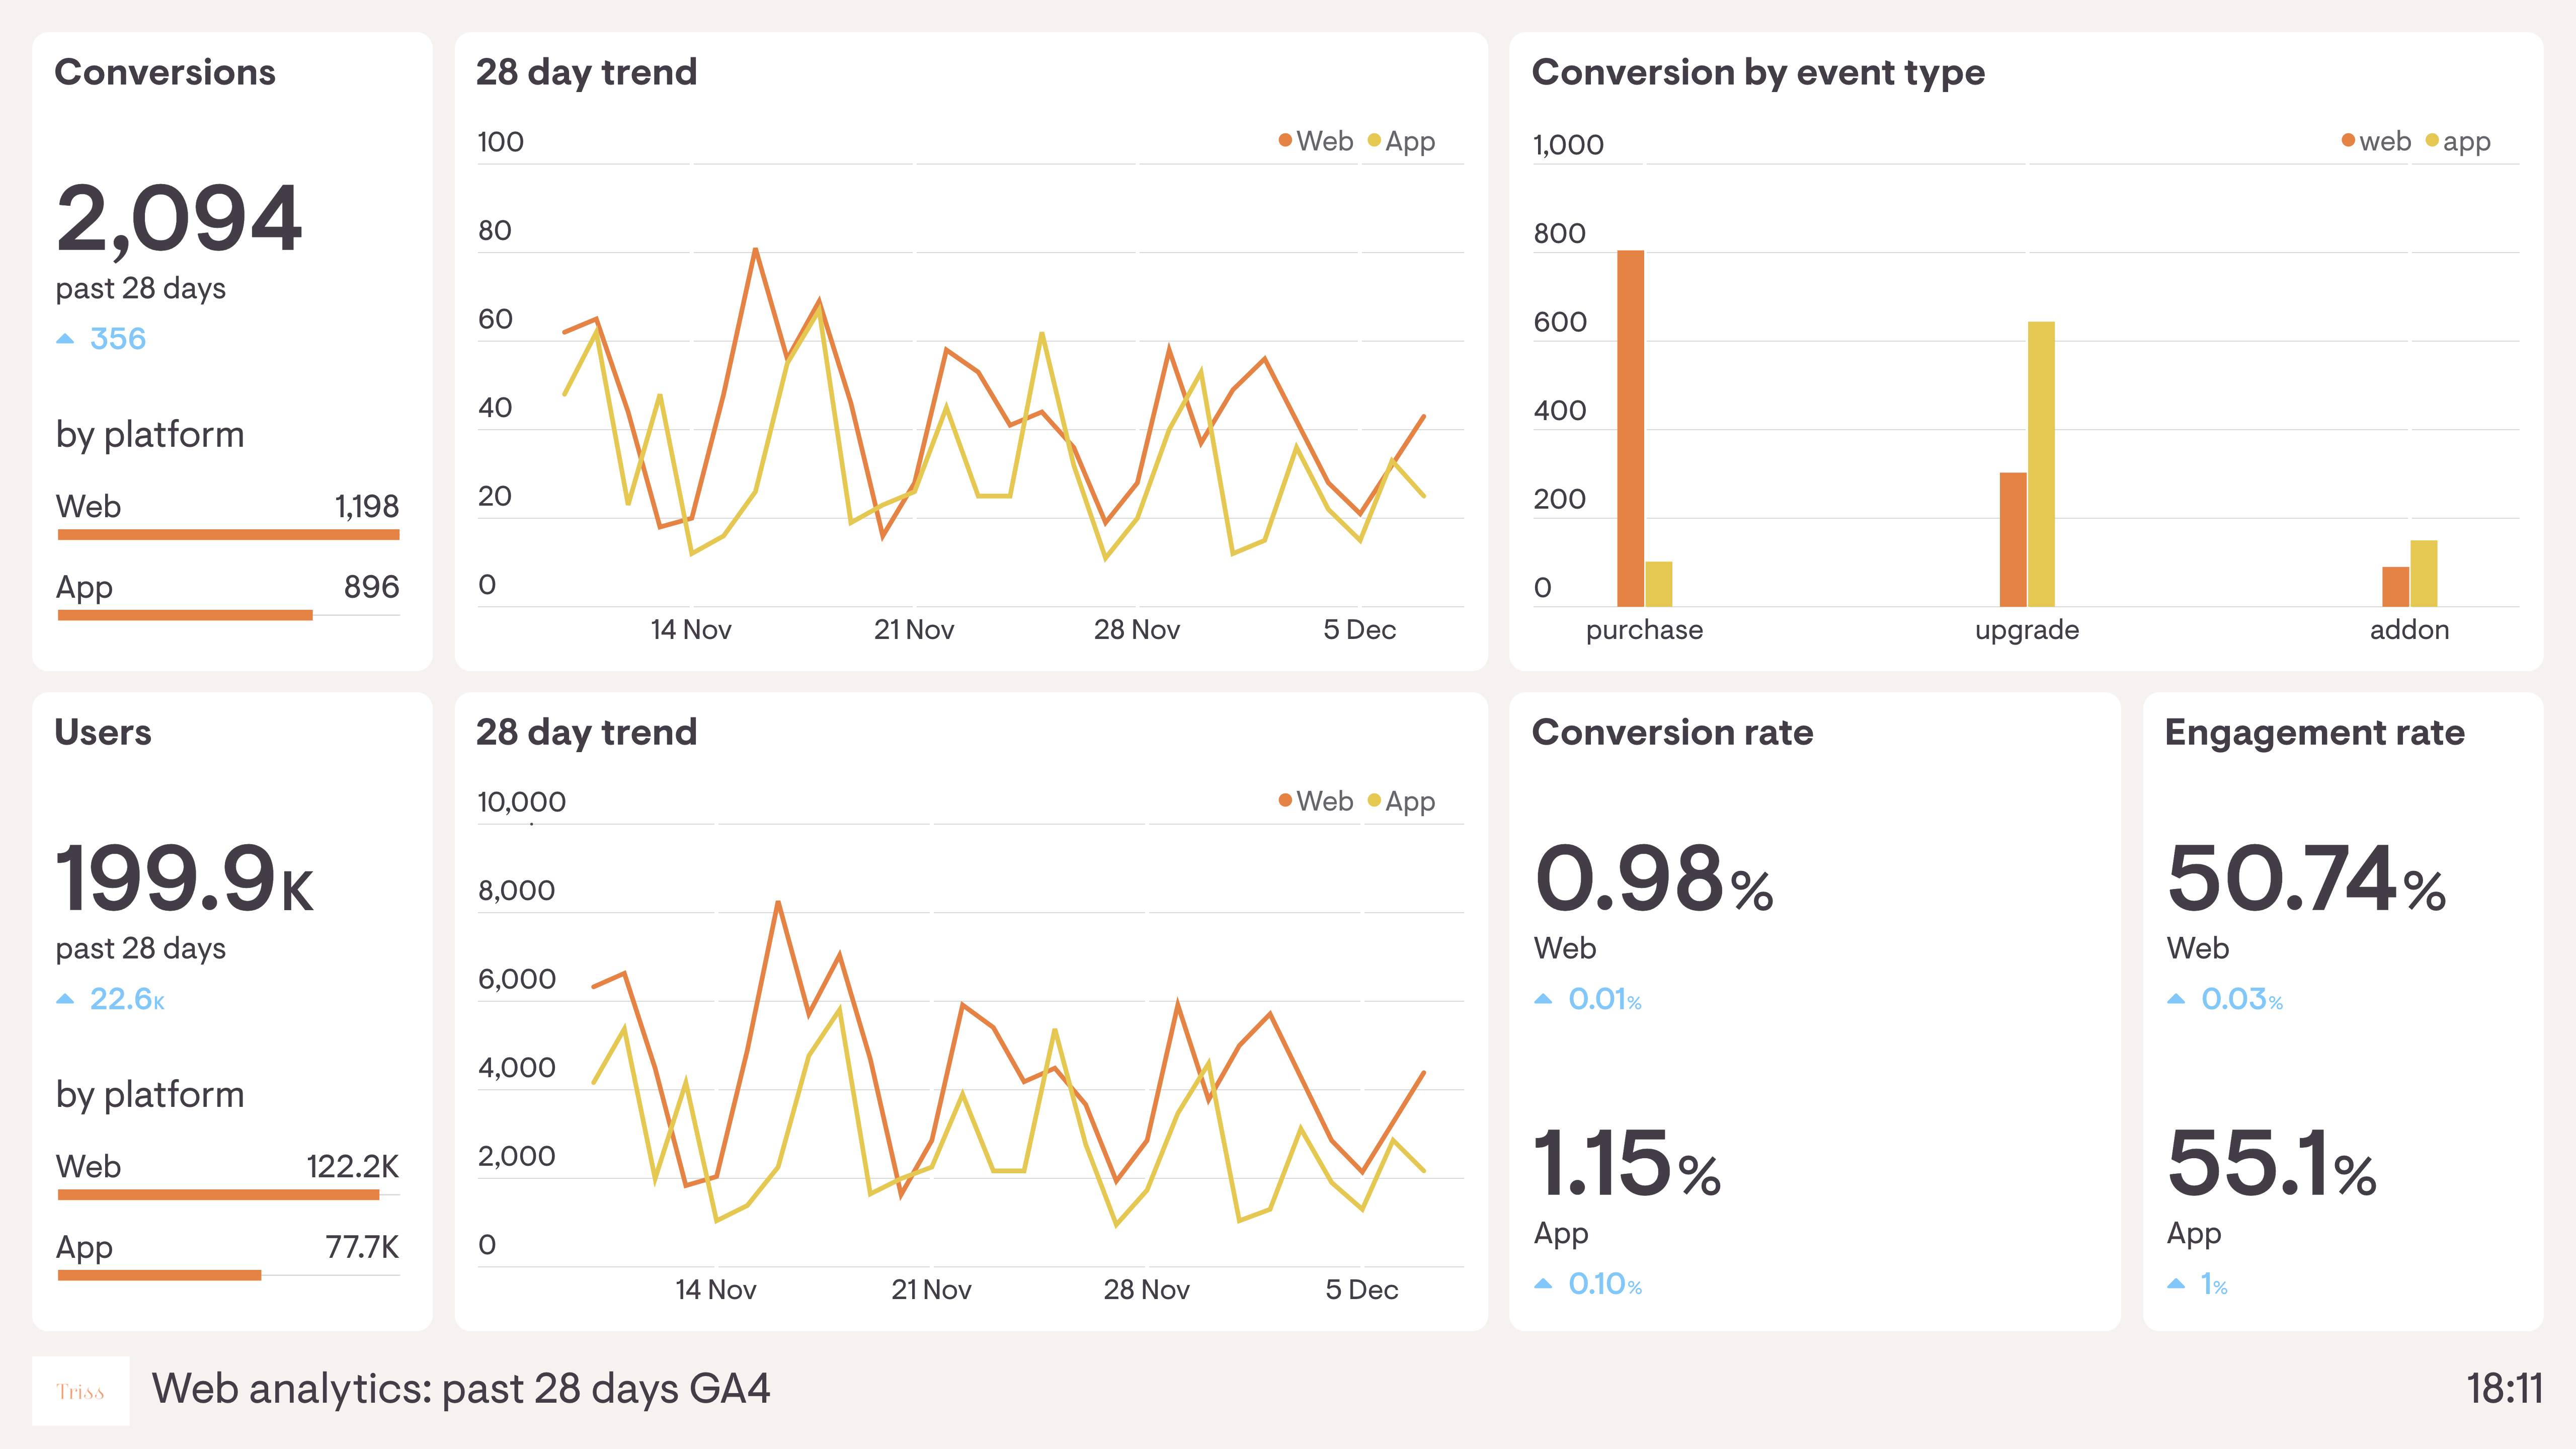
1. Dashboard Overview: The app's home page provides an overview of key metrics and performance indicators. It includes summary cards displaying metrics such as total website visitors, conversion rates, revenue, and average session duration.
2. Real-time Data Visualization: The dashboard incorporates real-time data visualization to present data trends and insights. It includes interactive charts, such as line charts, bar charts, and pie charts, to showcase metrics like website traffic, sales performance, and user engagement. Users can customize the date range and filter data based on specific parameters.
3. Performance Comparisons: The app offers the ability to compare performance metrics over time. Users can select specific periods and compare metrics side by side, allowing them to analyze trends, identify growth opportunities, and make data-driven decisions.
4. Segmentation and Filtering: The Analytics Dashboard app enables users to segment data based on various parameters. They can filter data by traffic sources, user demographics, device types, or any other relevant dimension, providing deeper insights into specific audience segments and their behavior.
5. Goal Tracking and Conversion Analysis: The dashboard includes features for tracking and analyzing conversion goals. Users can define and monitor key conversion events, such as form submissions or purchases, and track their performance. The app presents conversion funnels, showing the progression of users through different stages of the conversion process.
6. Custom Reports: Users can generate custom reports based on specific metrics and dimensions. The app allows users to select the desired data points, apply filters, and generate reports in various formats (e.g., PDF, CSV). These reports can be scheduled for automated delivery to relevant stakeholders.
7. User Behavior Insights: The Analytics Dashboard app provides insights into user behavior on the website. It includes metrics such as page views, bounce rates, and session durations. Users can explore user flow visualizations to understand the most common paths users take on the website and identify potential areas for improvement.
8. Integration with Third-Party Analytics Services: The app integrates with popular analytics services like Google Analytics or Mixpanel to retrieve and display data. This allows users to leverage existing analytics setups and access comprehensive data from these external sources.
Please note that this is a conceptual example, and the actual implementation of an Analytics Dashboard app with Laravel Filament would require custom development based on specific business requirements and integration with appropriate analytics APIs or services.
